

Key takeaways
- When you can't predict the query shape, or the engine won't be warm, choose the SQL analytics endpoint. The SQL analytics endpoint and Spark both answered all 7 shapes on every run (161 of 161 each), but Spark first needs a session start of about three minutes, and the endpoint's worst cold run was 37.8 s.
- When the query is a repeated aggregate on a model that stays warm, choose Direct Lake: about 0.6 to 0.8 s warm on every shape it could load, but its first successful load took 40 to 170 s, and the cold runs of 4 of 7 shapes failed every time.
- When the query is a row-level top 100 over the whole fact table, don't choose Direct Lake: 6 of 6 runs failed on the 10 GB per-query memory limit, cold and warm.
- When the query is a lookup on one table, Eventhouse answered in 0.011 s engine time. When it joins the fact table to another big table, don't use Eventhouse: 216 to 248 s, and 8 runs failed on low memory or returned 1 row.
- Seconds and CU-s rank the engines differently. Direct Lake was fastest warm on most shapes and used more than 10 times the CU of the SQL analytics endpoint over the same 7 queries (about 13 times, 17 counting failed and timed-out runs), much of it on cold loads, some of which failed.
- All numbers were measured on a 64-CU Fabric trial, not a statement about paid F64 or production SLAs. The schema and queries are TPC-H-derived.
A team has one Delta table with a billion rows and four ways to query it in the same workspace. Someone asks which one the new dashboard, the ad hoc analyst and the nightly job should use, and the docs answer with what each engine is, not which one fits the query in front of you.
This is the third post in my Fabric trial series. I loaded about one billion rows of TPC-H-derived data once, pointed Spark, the SQL analytics endpoint, a Direct Lake semantic model and an Eventhouse at it, and ran seven queries on each (six on Eventhouse), cold and warm. The short answer: no engine won every shape, and the engine that was fastest warm on most shapes was also the one that failed most often cold and cost the most.
Named model: shape, state, meter, ceiling
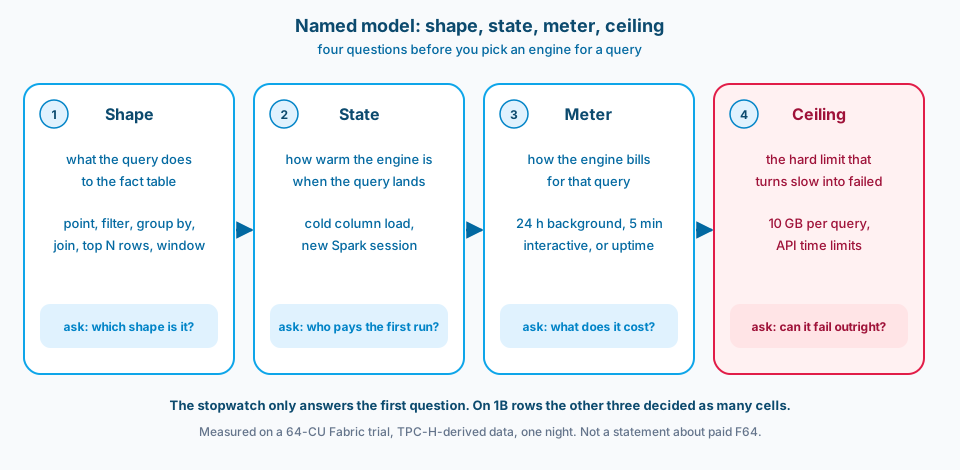
Figure 1. Speed is only one of four questions. In this run the state, the meter and the ceiling decided as many cells as the stopwatch did.
Which Fabric engine should you use for a billion-row query?
On about one billion rows on a 64-CU Fabric trial, the SQL analytics endpoint was the safe default: it answered all seven query shapes on every run, in 0.2 to 8.5 s engine time warm and at most 37.8 s cold at the caller. Direct Lake was the fastest warm engine for aggregates at about 0.6 to 0.8 s, but needed 40 to 170 s for its first successful load and failed every cold run on four of the seven shapes; one of them, a row-level top 100 query, hit the 10 GB per-query memory limit on every run, warm too. Eventhouse was fastest for a point lookup (0.011 s engine time) and slowest for joins. Pick by query shape and how warm the engine will be, not by one overall winner.
What I measured, and how
The method was fixed before the first measured run.
What this is and is not. A first-hand benchmark of four Fabric engines against each other, on synthetic data, on a Fabric trial capacity, over one night. It is not a vendor comparison, not a statement about paid F64 or production SLAs, and not an audited TPC result. The schema and queries are TPC-H-derived: the data comes from a seeded Spark generator, not the official dbgen tool. One night, one capacity, one dataset. Treat each number as "what this setup did", not as "what this engine does".
Capacity. A 64-CU Fabric trial. The trial uses the same smoothing and throttling model as a paid F64 and inherits its Power BI limits, including 10 GB of memory per query and 25 GB per semantic model (Power BI capacity SKUs). It differs in two ways that matter here: no autoscale and no overage billing (overage is for F SKUs only, capacity overage), and Spark gets 128 vCores with no burst and no queue, where a paid F64 bursts to 384 (Spark concurrency limits). Microsoft describes the SKU table as "a reference for comparing compute capacity, not as a statement of functional or licensing equivalence" (licenses).
Data. TPC-H-derived tables at about scale factor 170, generated in Spark from a hash of each key with a fixed seed (42), so a rerun gives identical data. Comment columns were dropped to keep the fact table narrow.
| Table | Rows | Files | Row groups | Size |
|---|---|---|---|---|
| lineitem (fact) | 1,019,997,836 | 24 | 96 | 25.5 GB |
| orders | 255,000,000 | 3 | 24 | 2.9 GB |
| customer | 25,500,000 | 1 | 8 | 395 MB |
| part | 34,000,000 | 1 | 8 | 507 MB |
| supplier, nation, region | small | 1 each | 1 each | under 25 MB |
Layout. Delta with V-Order switched on explicitly, because it is off by default in new workspaces (Delta optimization and V-Order), then optimized write and OPTIMIZE with a 1 GB maximum file size. No partitioning. Fact row groups came out at a median of 12.1 million rows (minimum 6.2 million), inside the 1 to 16 million rows per row group that Learn recommends for Direct Lake (Understand Direct Lake query performance). Every table stays far under the 5,000 files and 5,000 row groups Direct Lake allows on this capacity (Direct Lake overview).
Engines. All four read the same Delta tables, except Eventhouse, which needs its own copy.
| Engine | How it reads the data | Language | Client I timed with |
|---|---|---|---|
| Spark | Lakehouse tables, fixed custom pool: 8 Medium nodes, autoscale off, dynamic allocation off, the same pool for every run | Spark SQL | timer inside the notebook session |
| Warehouse | SQL analytics endpoint over the same Delta tables, no copy | T-SQL | Fabric Data Warehouse MCP server (preview), over HTTPS |
| Direct Lake | Semantic model over the same tables, Direct Lake only with no DirectQuery fallback, only the queried columns plus keys | DAX | Power BI Execute Queries REST API |
| Eventhouse | Native tables, batch ingested from the same Delta files (lineitem and part only), all rows in hot cache during the test window, no minimum capacity set, autoscale on | KQL | Kusto REST API |
For T-SQL I used the remote Fabric Data Warehouse MCP server, which is in preview (Data Warehouse MCP server). In my tests it stopped queries at 300 s and returned at most 10,000 rows. Those two caps are what I observed; Learn does not document them. In the measured runs no T-SQL query came near either: all 161 succeeded, the slowest took 37.8 s, and none returned an error.
Spark ran on a fixed pool of 8 Medium nodes, which is 64 vCores (32 CU at 2 vCores per CU, one node is the driver), half of the trial's 128 (Spark compute, Fabric operations). The trial has no Spark burst or queue (a paid F64 bursts to 384). That was a fixed choice so every Spark run had the same hardware, not a tuning result. The other engines size their own compute, and the Warehouse engine can burst above its base CU (burstable capacity).
Timing. Times are wall-clock as seen by the caller: the Execute Queries REST API for DAX, the Kusto REST API for KQL, the Fabric Data Warehouse MCP server (preview) for T-SQL, and a timer inside the session for Spark. That caller time is the headline number, because it is what a caller waits for. Engine-side times are shown alongside where the engine reports them: query insights elapsed time for the Warehouse (query insights) and .show queries Duration for Eventhouse (.show queries). Direct Lake and Spark times are caller-side only: I had no engine time for them. From about 02:09 UTC the machine I timed from was also busy with other work (about 380% CPU). That does not touch the Spark timer, which runs inside the session. For Eventhouse the gap between client and engine time stayed the same before and after (median 0.36 s before, 0.33 s after), so the load did not inflate client times there. Engine time does change one ranking, see the second results table.
Queries. Seven queries, the same intent in each engine's own language. Revenue is extended price times one minus discount.
| ID | Shape | What it does |
|---|---|---|
| q1 | Point lookup | One line item by order key and line number |
| q2 | Filtered aggregate | Revenue and line count for one ship month |
| q3 | Group by, one table | Revenue and line count by ship mode (7 groups) |
| q4 | Two joins | Revenue by market segment, through orders to customer (5 groups) |
| q5 | One join | Revenue by brand, through part (25 groups) |
| q6a | Row-level top N | The 100 line items with the highest revenue |
| q6b | Join plus window | Top 5 brands by revenue within each ship mode |
For q6a the KQL query breaks revenue ties by order key and line number, while DAX TOPN keeps ties and can return more than 100 rows, so the results match in intent, not byte for byte. Eventhouse holds lineitem and part only, so it has no q4. That makes 27 engine and query blocks, not 28.
Runs. Each block is 3 cold runs and then 20 warm runs, back to back. The 27 blocks ran one at a time, in an order shuffled with a fixed seed (42), so no engine always ran first or last, and the order is reproducible.
What cold means per engine. Each engine can be reset to a different degree, so cold does not mean the same thing everywhere.
| Engine | Cold run | What cannot be reset |
|---|---|---|
| Spark | A new session for each cold run, plus clearing the Spark cache. Session start is not part of cold; I report it separately | Intelligent cache on (the Fabric default), logged on every run. It is a node-local disk cache, and I did not clear it; Learn does not say whether it survives into a new session (intelligent cache) |
| Warehouse | First run, result set cache bypassed on every query with a query hint (result set caching), and a cache hit column of 0 checked for every run | In-memory and disk caches can't be flushed |
| Direct Lake | Clear the model's memory, then reframe it, then query, so columns load from OneLake again (Direct Lake storage states) | Nothing material |
| Eventhouse | First run; hot cache on by policy; query results cache not used (query results cache) | Learn documents no way to flush the hot cache, so cold here means first run, not empty cache |
Statistics. For warm runs I report the median and the p95, using nearest rank: sort the 20 durations and take value number ceil(0.95 × 20) = 19. With 3 cold runs I report the median and the maximum, because a p95 of three values means nothing. A run counts as failed if it returned an error or the wrong number of rows, even when the API said HTTP 200, and failed runs are reported as a count, never dropped from the story or averaged in. Where a block has failed runs, the median and p95 are over the runs that passed, and the table says how many that is.
Capacity use. When I checked on the evening of 30 October, the Capacity Metrics app showed no data for this new trial capacity. Learn says a new capacity appears in the app only after its next scheduled refresh at midnight (Metrics app). So the CU-s figures here are my estimates from the capacity's own utilization events in the Real-Time hub (capacity overview events), split by workload type (Fabric operations). They are not the per-operation figures the Metrics app reports. Background work (Spark, Warehouse queries, Eventhouse, Direct Lake refreshes) is smoothed over 24 hours and showed up as steps on 10-minute marks, so each block's CU is the sum of the steps for that block, and two blocks that finish in the same 10 minutes can't be told apart: those cells are marked as combined. Direct Lake queries from a custom app are interactive and smoothed over at least 5 minutes, so their block CU is the interactive use from the block start to 5.5 minutes after its end, cut at the start of the next Direct Lake block so no window is counted twice. About 11,000 CU-s of interactive use fell outside every window, spread out past 5.5 minutes, and is not added. The memory clears and refreshes before each Direct Lake cold run are background refreshes and are reported separately. Eventhouse is billed for the time it is active times the vCores it uses, so per-query CU does not exist for it, and its block total is capacity-wide Kusto uptime, including a small monitoring database and an idle baseline of about 1,200 to 1,600 CU-s per 10 minutes, so it does not scale with query count (Real-Time Intelligence consumption). For the Warehouse I cross-check the steps against the CPU time in query insights (Warehouse usage reporting). Every figure is a block total. Each total covers a billing slot, not a single operation. It includes any other work of the same type in that slot, such as the guard's checks and, for Eventhouse, idle and monitoring uptime. The 5-minute window for Direct Lake is a floor: Learn says interactive work is smoothed over 5 to 64 minutes, so large operations can spill past it. I do not divide a block total into a per-query figure that would look more precise than it is.
A calm capacity before each block. The capacity sat flat, under 5%, with no throttling and no carried-forward overage, for 30 minutes from 22:30 to 23:00 UTC. About an hour of setup load followed (Direct Lake tests, a Spark smoke test, and the Eventhouse ingest, which finished at about 00:02 UTC), so the first block did not start straight after the calm half hour. The runner started at 00:02:52 UTC, when the guard read a 5.6% delay and no overage, and the first block started at 00:02:57. Before every block the runner waited until the 10-minute delay limit was under 30% committed and overage was zero. Other scheduled work on the same trial (a heartbeat and a few small schedules) ran at about 5% background at the start gate, and I logged it rather than hide it. I did not compute the background share over the whole measured window, so treat it as unknown beyond the start gate.
What I changed during the run, and why.
- Direct Lake q6a: 6 of 6 runs failed (3 cold, 3 warm), out of memory at F64's 10 GB per-query limit; stopped early, because more runs would only spend CU. Two diagnostic queries I ran afterwards are not in the record or in any table.
- A stale access token hung the harness for about 18 minutes with the capacity idle; nothing was re-run, and no run counts changed.
- The runner first stopped on any overage. After Direct Lake runs (the failing q6a runs and the q3 cold runs) pushed the trial to 182% and 129% (overage protection, no throttling), I changed the guard to wait for carry-forward to burn down instead of stopping. The method did not change.
- Later Direct Lake blocks did throttle the capacity. During q4 the 10-minute interactive delay was at or over 100% from 03:17 to 03:22 UTC (peak 133.5%), and during q2 it peaked at 110.5%. The guard stopped the runner, waited for overage to burn down, and resumed with the next block. Runs that were visibly delayed are flagged in the tables and left out of the warm medians, not re-run.
- Eventhouse q6b: 5 of 20 warm runs returned 1 row instead of 35 and are counted as failures. The API returned HTTP 200, which Kusto does for some failures detected mid-query (partial query failures). For 4 of them
.show queriesreports State Failed with a low memory partial failure (E_LOW_MEMORY_CONDITION). The fifth took 112.9 s and has no.show queriesrecord, so I can't give its cause. - Eventhouse q5: the first attempt stopped on a client read timeout with no runs recorded and was run again in full. In the second attempt, 3 of 23 runs failed the same way: two low memory partial failures and one 133.9 s run with 1 row and no
.show queriesrecord. - Direct Lake q6b: the first attempt timed out before any run was recorded and was run again in full.
- Eventhouse q6a: not measured. My harness sent a KQL query with a syntax error, so all 6 runs failed before the engine did any work. That is my bug, not an engine result, and the cell says "not measured (harness bug; re-run pending)".
Measured. Night of 30 to 31 October 2026, 00:02:52 UTC to 09:00:11 UTC. Also running inside that window: the guard's own queries and the capacity-events ingestion that fed it, the heartbeat schedules, the two Direct Lake diagnostic queries (about 01:05 to 01:06 UTC, at the end of block 2), small query insights reads for the Warehouse checks, a .show queries check once a minute from about 05:20 UTC, and two short KQL test queries at about 05:13 UTC. Guard burn-down waits sat between blocks, never inside a timed query. One stray Spark job ran at 23:36 UTC, before the window, and started no session.
Results
The SQL analytics endpoint was rarely the fastest warm and never failed; Direct Lake was the fastest warm on most shapes it could load and the slowest or failing cold; Spark was steady in the middle; Eventhouse was best at a lookup and worst at joins.
Warm median and p95, seconds
| Query | Spark | Warehouse | Direct Lake | Eventhouse |
|---|---|---|---|---|
| q1 point lookup | 0.874 (1.215) | 1.046 (1.373) | 0.690 (0.985), see note 1 | 0.329 (0.344) |
| q2 one month | 4.159 (4.613) | 1.521 (1.754) | 0.633 (0.675), n=17; 3 runs delayed by throttling left out | 4.820 (5.310) |
| q3 by ship mode | 17.544 (18.464) | 1.312 (1.608) | 0.677 (0.810) | 59.151 (62.604) |
| q4 by segment, two joins | 47.079 (48.043) | 9.489 (10.501) | 0.674 (0.792), n=3; 17 runs delayed by throttling left out (they took 20.7 to 39.9 s, not an engine time) | not run (no orders or customer copy) |
| q5 by brand, one join | 39.564 (41.340) | 5.912 (6.215) | 0.657 (0.719) | 215.505 (221.486), 18 passed, 2 of 20 failed |
| q6a top 100 rows | 15.093 (16.151) | 1.988 (2.236) | failed, 3 of 3 warm runs (out of memory, 10 GB per-query limit; stopped early) | not measured (harness bug; re-run pending) |
| q6b top 5 brands per mode | 48.730 (49.818) | 7.112 (7.371) | 0.796 (1.363), see note 1 | 247.757 (250.202), 15 passed, 5 of 20 failed |
Median of 20 warm runs, p95 in brackets (nearest rank), unless the cell says fewer passed or gives n. Duration as timed by the caller in the engines table. Note 1: for Direct Lake q1 and q6b every cold run failed, so warm run 1 was the first load that worked (170.0 s and 122.0 s). It is in the 20 and is the slowest value, which nearest rank leaves out of the p95. Most throttled runs took a flat 20.7 s, which matches the 20-second delay Fabric adds to interactive jobs while it throttles ("Fabric delays user-requested interactive jobs by 20 seconds at submission", throttling). The exception is q4 warm 1 at 39.9 s, which ran just before throttling began. Throttled runs are left out of the median and p95 (the cell gives n), but they stay in the run counts, and none was re-run. Measured on a 64-CU Fabric trial, not a statement about paid F64 or production.
Client time and engine time, warm median, seconds
| Query | Warehouse, client (MCP server) | Warehouse, engine (query insights) | Eventhouse, client (Kusto REST) | Eventhouse, engine (.show queries) |
|---|---|---|---|---|
| q1 point lookup | 1.046 | 0.175 | 0.329 | 0.011 |
| q2 one month | 1.521 | 0.462 | 4.820 | 4.500 |
| q3 by ship mode | 1.312 | 0.390 | 59.151 | 58.844 |
| q4 by segment, two joins | 9.489 | 8.538 | not run | not run |
| q5 by brand, one join | 5.912 | 5.048 | 215.505 | 214.978 |
| q6a top 100 rows | 1.988 | 0.989 | not measured (harness bug; re-run pending) | not measured (harness bug; re-run pending) |
| q6b top 5 brands per mode | 7.112 | 6.081 | 247.757 | 247.404 |
Spark and Direct Lake report no separate engine time I could use here, so they have caller time only. The MCP server added about 0.9 to 1.1 s to every Warehouse query and the Kusto REST API about 0.3 s. On q1 to q3 that hop is the difference: by caller time Direct Lake beats the Warehouse, by engine time the Warehouse would be ahead. I can't measure Direct Lake's own hop, so for sub-second shapes read those two columns as a tie, not a win. Warehouse against Eventhouse ranks the same either way.
Cold median and worst of three, seconds
Each cell is cold median / cold max of the 3 cold runs.
| Query | Spark | Warehouse (first run) | Direct Lake | Eventhouse (first run) |
|---|---|---|---|---|
| q1 point lookup | 40.479 / 48.736 | 1.490 / 13.422 | failed, 3 of 3 (2 out of memory, 1 HTTP 500) | 0.323 / 0.384 |
| q2 one month | 40.582 / 103.141 | 8.283 / 20.233 | 60.714 / 62.029 | 4.928 / 11.439 |
| q3 by ship mode | 82.138 / 88.949 | 1.707 / 15.192 | 60.188 / 60.211 | 59.894 / 60.221 |
| q4 by segment, two joins | 75.833 / 77.266 | 10.326 / 23.418 | failed, 3 of 3 (parquet read error after about 230 s) | not run |
| q5 by brand, one join | 80.469 / 105.089 | 6.309 / 13.461 | 150.934 / 152.301 | 214.141 / 217.332, 2 passed, 1 failed |
| q6a top 100 rows | 82.364 / 84.610 | 2.373 / 3.430 | failed, 3 of 3 cold runs (out of memory, 10 GB per-query limit) | not measured (harness bug; re-run pending) |
| q6b top 5 brands per mode | 87.476 / 89.326 | 7.615 / 37.835 | failed, 3 of 3 (out of memory) | 242.456 / 245.551 |
Each cold Spark run is a new session; starting it took 163 to 301 s (median 170 s) across the 21 cold runs and isn't in the timing (Learn: about 3 minutes for custom pools, 2 to 5 minutes for custom configurations, Spark compute). The Direct Lake memory clear and reframe before each cold run took about 7 to 12 s each and isn't in the timing either.
Capacity use, CU-s
| Query | Spark (block total) | Warehouse (block total) | Direct Lake queries (block total) | Eventhouse (block total, uptime) |
|---|---|---|---|---|
| q1 point lookup | 5,841 | 6,487, combined with q4 | 27,118 | 3,900, combined with q6a |
| q2 one month | 10,381 | not separated (their billing step fell outside the block window; 207 s of CPU over 23 runs) | 53,325 | 1,485 |
| q3 by ship mode | 23,763 | not separated (their billing step fell outside the block window; 416 s of CPU over 23 runs) | 23,857 | 11,205 |
| q4 by segment, two joins | 39,412 | in the q1 cell | 75,475 | not run |
| q5 by brand, one join | 35,578 | 6,063 | 44,485 | 37,005, plus 4,875 for the first attempt |
| q6a top 100 rows | 21,695 | 8,374, combined with q6b | 67,871, 6 runs, all failed (includes the 2 diagnostic queries) | in the q1 cell (not measured) |
| q6b top 5 brands per mode | 49,443 | in the q6a cell | 46,921, plus 12,133 for the first attempt, which timed out | 31,380 |
| All 7 queries | 186,112 | 20,924, without q2 and q3 | 351,185 | 89,850, capacity-wide uptime |
Block totals cover 23 runs plus engine overhead in the block window, including the guard's waits. Cells marked combined finished in the same 10-minute billing step and can't be split. Warehouse CU is the same order as its CPU time in query insights: within 1% for q1 + q4 (6,487 CU-s vs 6,528 s of CPU), but 36% and 58% above it for q6a + q6b (8,374 vs 6,154) and q5 (6,063 vs 3,843). The 10-minute step includes other SQL work in the same slot. Direct Lake refreshes before cold runs (5,152 CU-s in total) are not in the table. A billing step shared by two blocks is counted once. In total the measured blocks used about 648,000 CU-s, about 12% of the 5,529,600 a 64-CU capacity has in 24 hours (about 653,000 with reframes), OneLake charges excluded.
Getting the data ready, per engine
| Engine | Preparation | Time | Extra storage |
|---|---|---|---|
| Spark | Delta build and layout (shared by Spark, Warehouse and Direct Lake) | 553 s to generate, then two layout passes on the fact table (491 s and 436 s) | about 29 GB of Delta, shared |
| Warehouse | none, reads the same Delta | 0 | none |
| Direct Lake | framing; the first column load is the cold column above | about 11 s for a memory clear plus reframe | none |
| Eventhouse | batch ingest of lineitem and part | about 1 hour (the trial throttled the ingest to 3 files at a time) | its own copy of lineitem and part |
Preparation ran before the measured window, so its CU is not in the capacity table above.
Failed runs
| Engine and query | Runs | Failed | What failed |
|---|---|---|---|
| Direct Lake q6a | 6 (3 cold, 3 warm) | 6 | Out of memory at F64's 10 GB per-query limit; stopped early |
| Direct Lake q1 | 23 | 3 (all cold) | 2 out of memory after about 219 to 232 s, 1 HTTP 500 after 240 s |
| Direct Lake q4 | 23 | 3 (all cold) | "Unexpected parquet exception" after about 230 s |
| Direct Lake q6b | 23 | 3 (all cold) | Out of memory after 123 to 144 s |
| Eventhouse q6b | 23 | 5 (all warm) | Returned 1 row instead of 35 with HTTP 200: 4 low memory partial failures, 1 with no engine record |
| Eventhouse q5 | 23 | 3 (1 cold, 2 warm) | Returned 1 row instead of 25 with HTTP 200: 2 low memory partial failures, 1 with no engine record |
| Eventhouse q6a | 6 | 6, not measured (harness bug; re-run pending) | My harness sent a KQL syntax error; not an engine result |
No Spark or Warehouse run failed: 161 of 161 each.
A pre-run test of q1 returned HTTP 500 after about 242 s. Learn documents no time limit for Execute Queries, so I can't say which limit it hit (Execute Queries). It was not a measured run and is not in the tables. The measured q1 block went the same way: all 3 cold runs failed, two with the engine reporting not enough memory and one with HTTP 500 after 240 s. The first warm run then answered in 170.0 s, and the other 19 in 0.55 to 0.99 s.
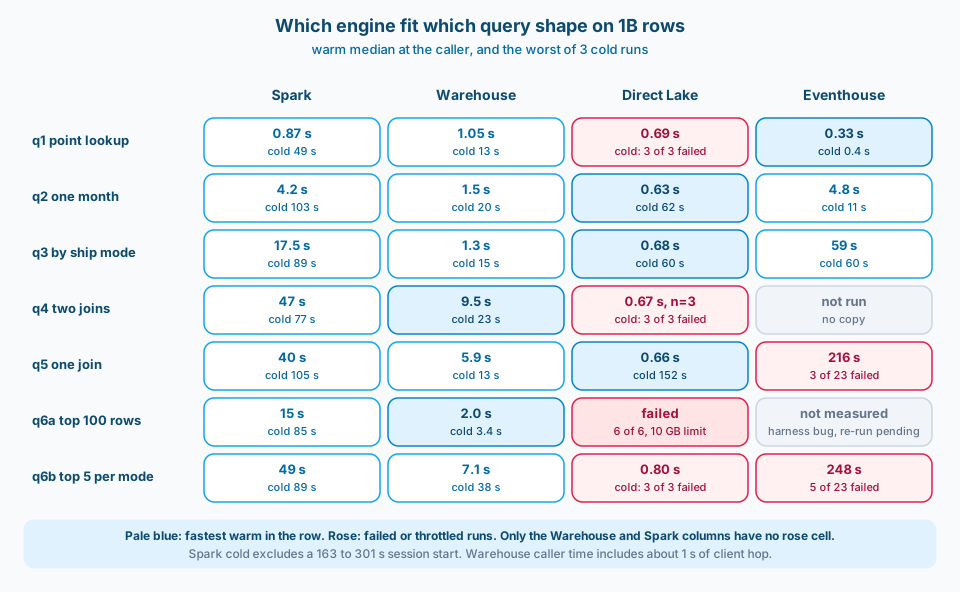
Figure 2. Once warm, Direct Lake is fastest on most shapes. Cold, it is the engine most likely to fail, and the SQL analytics endpoint and Spark have no red cells.
Shape: which engine fit which query
Point lookup (q1). Eventhouse found one row in a billion in 0.011 s engine time warm (0.06 s at most cold) and about 0.33 s at the caller, cold or warm. The Warehouse took 0.18 s in the engine. Direct Lake answered warm in 0.69 s, but only after three failed cold loads: a point lookup still makes Direct Lake load the key columns of the whole fact table.
Aggregates on one table (q2, q3). Direct Lake answered in about 0.65 s warm, the Warehouse in 0.39 to 0.46 s engine time. Eventhouse was fine for one month (4.8 s) and slow grouping the whole table by ship mode (59 s). Spark took 4 to 18 s.
Joins (q4, q5, q6b). This is where the engines split. The Warehouse answered every join in 6 to 9.5 s warm. Direct Lake was sub-second warm on q5 and q6b, but two of the three join shapes failed every cold run. Eventhouse took 216 to 248 s on the join to part and failed 8 of 46 runs on low memory or with a 1-row answer. Spark took 40 to 49 s.
Row-level top N (q6a). Sorting a billion rows to return 100 of them is cheap for the Warehouse (about 1 s in the engine) and impossible for Direct Lake here: every run hit the 10 GB per-query limit. The top 5 brands per ship mode (q6b) ranks only 175 groups, so the same model could answer it once loaded.
State: what cold costs
Direct Lake is where state matters most. A cold run means loading the columns from OneLake into memory: 60 s for the one-table aggregates, 151 s for the join to part, and on four shapes a failure after two to four minutes. After that, everything it could answer took under a second. If a model goes cold often, for example after a reframe or when memory is evicted, the first user pays that bill, and on 1B rows that user may get an error instead.
Spark pays at session start: 163 to 301 s for a new session on a custom pool, then a median of 40 to 87 s for the first query in it, then 0.9 to 49 s warm. For a job that runs once a night that is fine. For an analyst waiting on an answer it isn't.
The Warehouse and Eventhouse had the smallest cold penalty, but their caches could not be emptied, so cold here means first run, not empty cache. The Warehouse's worst first run was 37.8 s (q6b), and the other two cold runs of the same query took 7.2 and 7.6 s.
Meter: what the seconds cost
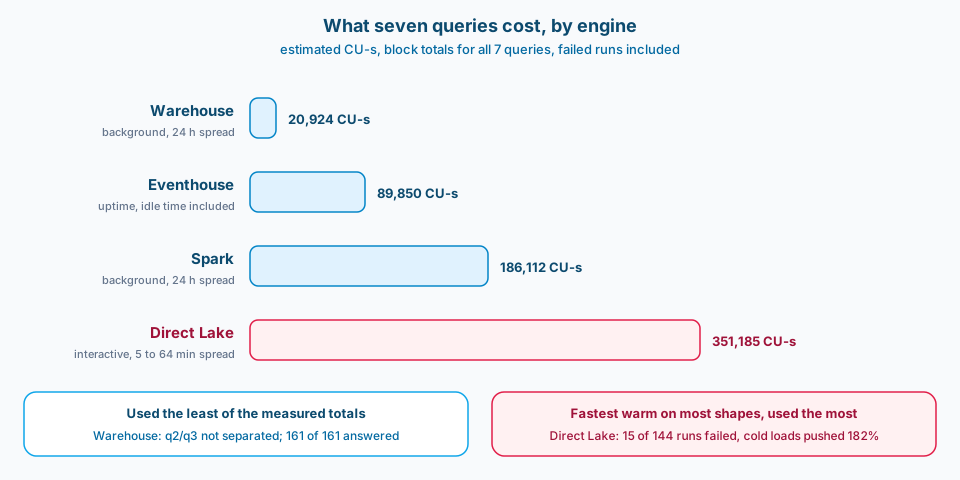
Figure 3. Seconds and CU-s rank the engines differently: the engine that was fastest warm on most shapes used the most capacity, and the SQL analytics endpoint used the least of the measured totals (q2/q3 not separated).
Each engine bills a query in a different way (Fabric operations). Warehouse and Spark work is background: it is spread over 24 hours, so a heavy query barely moves the capacity in the minute it runs. Direct Lake queries from an app are interactive: Fabric spreads them over as little as 5 minutes (up to 64 for the largest) (throttling), so a few heavy cold loads can push the capacity into throttling in minutes. That is what happened here: Direct Lake cold loads pushed the trial to 182%, and two later blocks crossed into throttling (peak 133.5%). While that lasted, 19 warm Direct Lake runs were delayed: q4 warm 2 to 17 and q2 warm 1, 19 and 20 each took a flat 20.7 s. Eventhouse bills for the time it is up, so its cost is about how long it stays active, not how many queries you run.
Over the same seven queries Direct Lake queries used more than 10 times the CU of the Warehouse (about 13 times, 17 counting failed and timed-out runs). Some of that is real work on 1B rows, and much of it is cold loads, including the ones that failed. For a dashboard that is hit a thousand times a day on a model that stays warm, the cold load is paid once and the per-query cost is small. For queries that arrive rarely or after the model goes cold, you pay the load every time.
Ceiling: where slow turned into failed
- Per-query memory. Direct Lake's row-level top 100 over the full fact table failed 6 of 6 runs (3 cold, 3 warm) at F64's 10 GB per-query limit (the error reported 10,240 MB used of a 10,240 MB limit); I stopped early. The group-level top N (q6b) did not hit that limit once the model was loaded. Separately, two diagnostic queries after the block also failed (a 3-column rewrite failed at 10,388 MB); they are not in the record.
- Memory while loading. Cold loads for q1 and q6b failed with the engine reporting 'there isn't enough memory' (it reported 39 to 58 GB consumed, more than the 25 GB F64 model limit, so that figure is not the model's own memory), and q4 failed with a parquet read error, each after two to four minutes.
- Failed queries still use CU. The failing Direct Lake runs pushed the trial to 182% and 129%, inside overage protection, with no throttling, and the carry-forward burned down in under 5 minutes each time. Later Direct Lake blocks did cross into throttling (peak 133.5%).
- API time limits. A Direct Lake q1 test returned HTTP 500 after about 242 s, and so did one measured cold run after 240 s. Learn documents no time limit for Execute Queries, so I can't say which limit it hit.
- Engine memory per query in Eventhouse. The join to part failed on low memory in 6 of 46 runs, and two more returned 1 row with HTTP 200 and no engine record.
- Client caps. No Warehouse query came near the 300 s cap I observed on the MCP server (preview); the slowest was 37.8 s. That cap is observed, not documented, and belongs to the client, not the engine.
Common mistakes
- Picking on warm medians. Direct Lake answered q5 in 0.66 s warm, and 151 s cold. Four other shapes didn't answer cold at all.
- Treating a failed query as free. The six failed Direct Lake q6a runs returned nothing, yet the q6a block, failures included, used 67,871 CU-s and pushed the trial to 182%.
- Comparing CU-s across different meters. A 10-minute billing step, a 5-minute interactive window and an uptime bill are not the same unit of work.
- Benchmarking the Warehouse cache. Result set caching is on by default for the Warehouse and the SQL analytics endpoint. Switch it off per query and check the cache hit column, or you are timing the cache.
- Trusting HTTP 200. Eventhouse returned HTTP 200 with 1 row for 8 failed runs. Check the row count, not the status code.
- Calling a trial result F64 performance. Same smoothing model and Power BI limits, different Spark limits, no autoscale and no overage billing.
Use as-is or adapt
Use as-is
- Run every engine and query block once, in an order shuffled with a fixed seed, one block at a time.
- 3 cold runs then 20 warm runs per block. Median and nearest rank p95 for warm, median and max for cold.
- Per engine cold controls from the table above, and say what could not be reset.
- Wait for a calm capacity before each block: no overage, delay limit low.
- Count failed and wrong-row-count runs, and report them.
Adapt
- The queries: use the three or four shapes your reports and jobs actually run.
- The data size and width: Direct Lake loads only the columns a query touches, so a wide fact table changes the memory picture.
- The Spark pool: size it to what your jobs will get in production.
- The client: time with the client your users will use, and say which one it is.
- CU attribution: per query where the engine allows it, block level where it does not, and keep block windows from overlapping.
Method notes and caveats
- Measured on a 64-CU Fabric trial, not a statement about paid F64 or production. One night, one capacity, one dataset.
- TPC-H-derived schema and queries from a seeded Spark generator. Not the official dbgen and not an audited TPC result.
- No comparison with any other vendor's product. This post compares Fabric engines with each other only.
- Durations are caller-side as described in the engines table, so they include each client's network hop. Direct Lake and Spark have caller time only. Engine-side times for the Warehouse (query insights) and Eventhouse (.show queries Duration) are in their own table. By engine time the Warehouse could be ahead of Direct Lake on q1 to q3, so I read those as a tie; no other ranking changes. The busy client after 02:09 UTC did not change the Eventhouse client overhead.
- Warehouse cold runs are first runs with the result set cache bypassed; the in-memory and disk caches can't be flushed. Eventhouse cold runs are first runs with the hot cache on by policy and the query results cache not used.
- Spark cold runs exclude session start, which is reported separately. Spark's intelligent cache was on and not cleared.
- The Spark pool used 64 of the trial's 128 Spark vCores (32 CU) by design. The other engines size their own compute.
- Background load from other scheduled work on the trial was about 5% at the start gate. I did not measure it over the whole window.
- All CU figures are my estimates: block totals from 10-minute billing steps or interactive windows of at least 5 minutes, and their windows include the guard's waits. They are not the per-operation figures the Capacity Metrics app reports.
- Throttled Direct Lake runs (q4 warm 2 to 17, q2 warm 1, 19 and 20, plus q4 warm 1 at 39.9 s just before throttling began) are left out of the warm medians, which use the clean runs only (n shown); I did not re-run them.
- The Warehouse client is a preview MCP server. Its 300 s and 10,000-row caps are what I observed, not documented limits.
- p95 is nearest rank, ceil(0.95 × n). With 20 warm runs that is the 19th of 20 sorted values.
Related
- Microsoft Fabric series (every Fabric post, including the trial experiments)
- Fabric Mirroring Lag: Where the Minutes Go (trial series 1: the same trial capacity, measuring freshness instead of speed)
- Fabric Data Agents: What a 20-Question Baseline Proves (the same TPC-H-derived schema at a small scale, asked in plain English)
- Gold + Direct Lake: Direct Lake or Import for Large Fact Tables? (the modelling side of putting a large fact table behind Direct Lake)
- Warehouse Views: Should Heavy Views Be Materialized for Direct Lake? (what to do when a join is too heavy to run on every query)
If you only change one habit, time your query cold as well as warm, on the engine and client your users will actually hit, and count the runs that fail.