

Key takeaways
- MLV performance work starts with wall-clock baselines and per-view attribution.
- NEE warnings are classified as actionable, investigate, or accepted with owners.
- Rewrites require measured latency impact, not warning count reduction alone.
- Slow nodes are isolatable via per-view diagnostic notebooks.
- Accepted warnings are documented for on-call and revisited after runtime changes.
- Capacity and concurrency checks accompany SQL fallback analysis.
Materialized Lake View runs paste warning floods that mention native execution engine fallbacks. Teams panic-rewrite Spark SQL to chase every line. Meanwhile the DAG's wall-clock still hides in one slow node nobody measured.
Measure first. Pasted warnings include Delta and MLV metadata internals you cannot and need not remove. Wall-clock attribution beats fear-driven rewrites. Fix the few fallbacks that move latency. Ignore the rest deliberately. Document accepted warnings so on-call does not thrash. Pair with per-view notebooks so slow nodes are isolatable.
Named model: baseline → classify → fix movers
- Baseline: record end-to-end MLV DAG duration and per-view timings before anyone rewrites SQL.
- Classify: sort NEE lines into actionable, investigate, or accepted with an owner and revisit trigger.
- Fix movers: prove before/after latency on hot stages; leave cheap fallbacks documented and alone.
- Rule: actionable fallbacks are a latency budget problem, not a zero-warning purity contest.
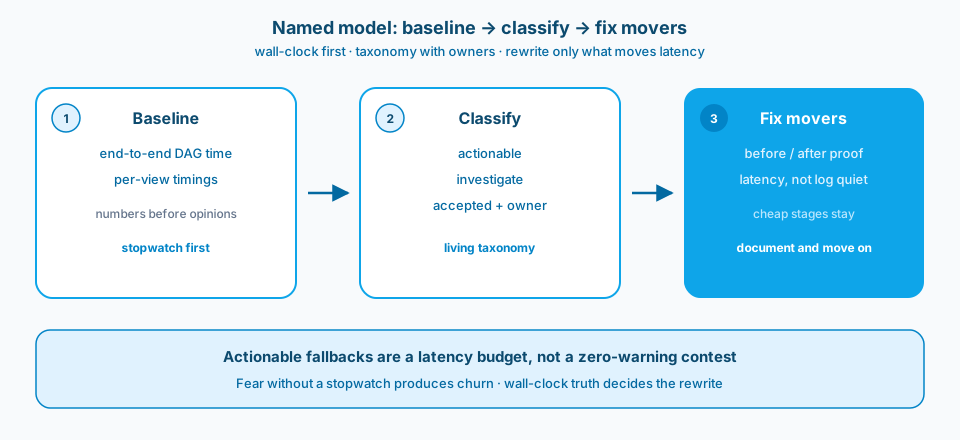
Figure 1. Named model for NEE work on . Numbers first, taxonomy second, rewrites only where wall-clock moves.
Context and constraint
Warning walls look urgent and usually contain very little that is actionable. The useful work begins when you time stages, isolate views, and keep an accepted-warning list. Latency drops when you fix the few fallbacks that matter, not when you chase every one that does not.
Some NEE messages are environmental noise around metadata and platform internals. Others mark operators that truly leave native paths and cost minutes. Your job is attribution: which warnings correlate with wall-clock, which are accepted, and which earn a rewrite. Fear without a stopwatch produces churn.
Figure 2 is the Fabric Spark job surface that makes stage time visible. Attribute there first; open warning text on the critical path second.
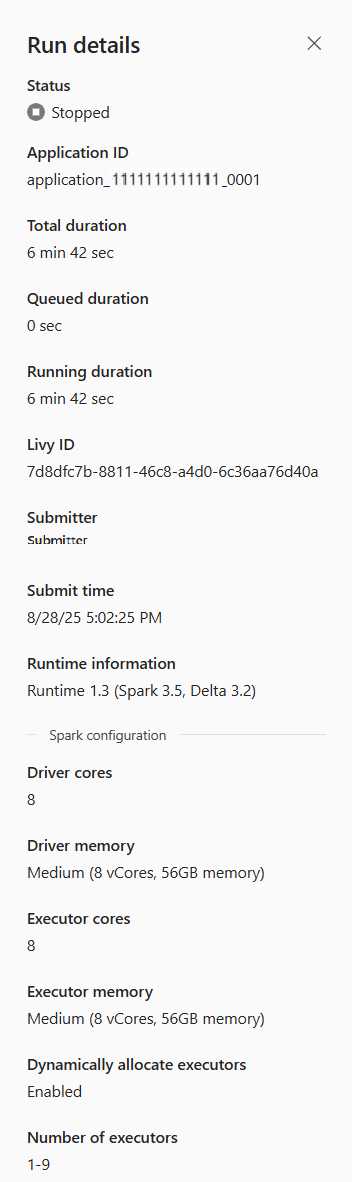
Figure 2. Attribute MLV time with job details and DAG reality. Do not treat every NEE warning as a rewrite mandate. Source: Microsoft Learn: Spark monitoring overview.
1. Capture wall-clock before rewriting SQL
Record end-to-end MLV DAG duration and per-view timings. Without a baseline, every change looks like a win in a meeting and a wash in production. Numbers first, opinions second. Figure 1 is that order drawn as three jobs.
2. Classify warnings into actionable vs accepted
Build a short taxonomy: known noise, investigate, must-fix. Update it when the platform changes. A living list beats rediscovering the same scary text each quarter. Figure 3 is the bucket shape on-call can read at 2 a.m.
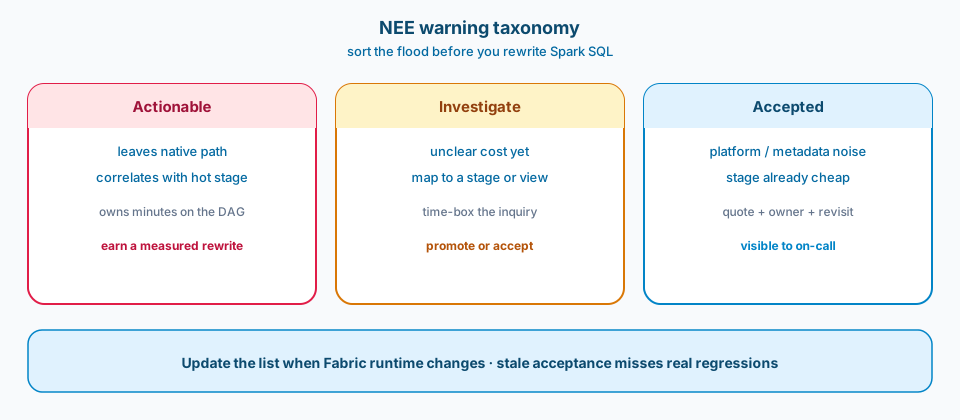
Figure 3. Sort the flood before you rewrite. Actionable owns minutes. Investigate gets a time-box. Accepted stays visible with an owner and a revisit trigger.
3. Fix only fallbacks that move latency
Prove with before/after timings that a rewrite helps. If a fallback remains and the stage is already cheap, document and move on. Heroic SQL that saves a trivial slice of a long DAG is theatre.
4. Isolate slow nodes with per-view notebooks
When a DAG is opaque, run suspicious views alone. Isolation turns "the MLV is slow" into "this join pattern is slow." Shared clusters and shared blame help nobody. Figure 4 is the ownership split that ends folklore.
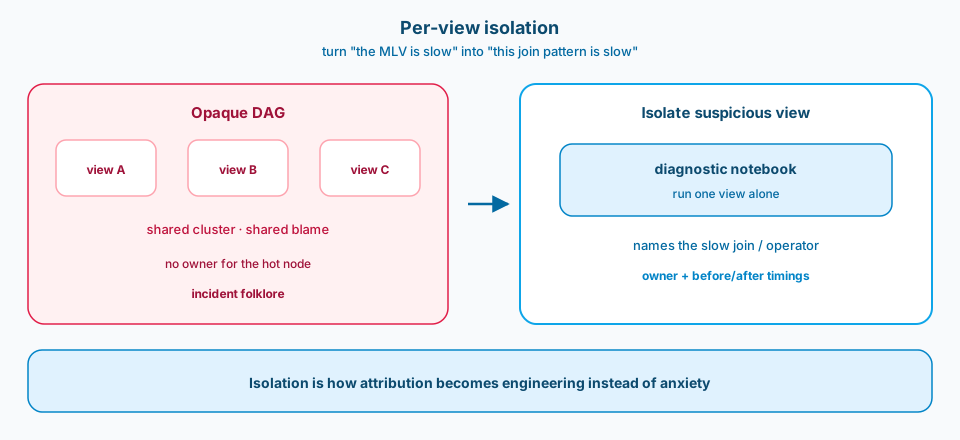
Figure 4. Opaque DAGs produce shared blame. A diagnostic notebook that runs one view alone names the slow operator and gives someone an owner.
5. Keep accepted warnings visible to on-call
Publish the accepted list beside the runbook. On-call should not page itself over documented noise at 2 a.m. Silence without documentation is how noise becomes ignored signal later.
6. Revisit after platform upgrades
Native engines evolve. A warning that was noise may become actionable, or the reverse. Schedule revisits after Fabric runtime changes. Stale accepted lists are how you miss real regressions.
How to attribute without drowning in Spark UI
Start with the MLV run's total duration and the top three stages by time. Map stages to views or operators you own. Only then open warning text for those hot stages. Reading every warning in a cold run teaches anxiety. Reading warnings on the critical path teaches engineering. Save full warning dumps as artifacts; analyze selectively.
What belongs in an accepted-warning ADR
Quote the warning pattern, why it appears, why it is accepted, who owns the revisit, and which metric would force reopening. Include a sample log line. Vague acceptance ("platform stuff") fails the next hire. Specific acceptance survives upgrades and audits.
Pairing with capacity and concurrency truth
Sometimes MLV wall-clock is queueing and throttling, not NEE. Measure concurrency and capacity metrics beside fallback work. Otherwise you burn a week "fixing" Spark while the platform simply oversubscribed the same slot. Attribution includes environment, not only SQL shape.
Communicating results without warning theatre
When you tell stakeholders an MLV got faster, show wall-clock and the one or two fallbacks you fixed. Do not celebrate a quieter log if duration did not move. Quiet logs with unchanged latency train leadership to fund cosmetics. Loud logs with a clear accepted list train leadership to fund measurement. Prefer charts of duration by view over screenshots of yellow warning text.
Failure modes
Warning zero as KPI. Teams rewrite for cosmetics. Log quiet; DAG unchanged.
No baseline. Changes cannot be judged. Every PR claims a win.
DAG-only folklore. "It has always been slow." Nobody names a view or stage.
Undocumented acceptance. Every on-call relearns panic over the same metadata lines.
Never revisit. Old noise classifications outlive truth after a runtime upgrade.
Shared blame. No per-view isolation, no owners. Figure 4 is that failure made visible.
What to copy / what not to copy
Copy
- MLV performance work starts with wall-clock baselines and per-view attribution.
- NEE warnings are classified as actionable, investigate, or accepted with owners.
- Rewrites require measured latency impact, not warning count reduction alone.
- Slow nodes are isolatable via per-view diagnostic notebooks.
- Accepted warnings are documented for on-call and revisited after runtime changes.
- Capacity and concurrency checks accompany SQL fallback analysis.
Do not copy blindly
Accepted-warning lists feel like giving up; zero-warning crusades feel productive and waste weeks. Per-view notebooks add operational paths; opaque DAGs add longer incidents. Revisit schedules are calendar load; skipping them is silent regression risk. Proving latency wins slows PRs and prevents false victory blogs.
Primary references: Spark monitoring overview and Materialized Lake Views overview on Microsoft Learn. Pair them with your accepted-warning list so engineers know which reality they are optimizing.
Time the DAG. Classify the noise. Fix what moves latency. Document what you accept. Isolate slow views. Revisit after upgrades. Most NEE lines are not your emergency. Wall-clock truth is.